Top 10 US Monthly Covered Calls – November 2025
US Covered Calls • Monthly Options • Nov 21, 2025 (3rd Friday)
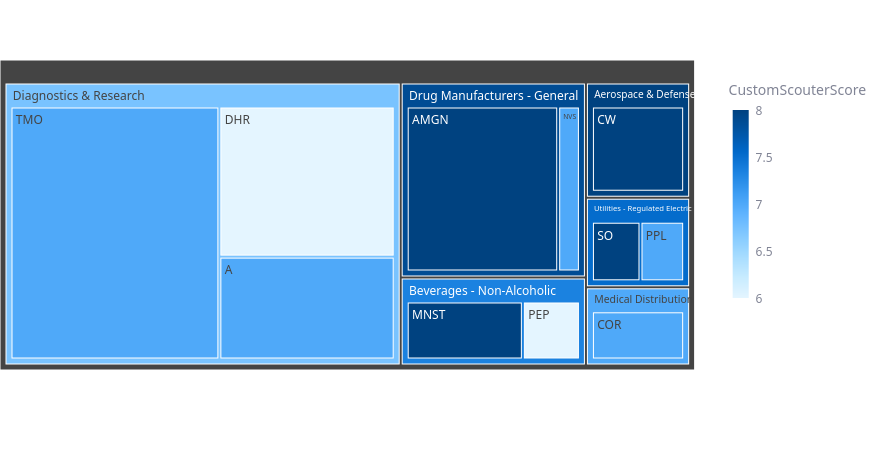
US Covered Call Screen Snapshot for November 2025 (Expires Fri, Nov 21)
Important Disclosure (Read This First)
This page is provided for informational and educational purposes only.
It does not constitute investment advice, trading advice, or a recommendation or solicitation
to buy, sell, or hold any security or derivatives instrument.
The information is general and impersonal in nature and does not consider your financial situation,
objectives, experience, or risk tolerance.
Optrader.ca is not registered as a broker-dealer or investment adviser in the United States.
Users are solely responsible for their own decisions and for verifying contract terms with their broker.
For the November 21, 2025 expiry (the 3rd Friday of November), the results below reflect a rules-based screening snapshot on US-listed optionable stocks. Candidates were ranked primarily by November seasonality win rate (when available), then cross-checked using ROO %, Δ (delta), options liquidity (OI), Scouter Score, and sentiment. This is a screen, not a prediction.
What the Metrics Mean
- ROO % (Return on Option): premium yield for this expiry window (not annualized).
- Δ (Delta): proxy for assignment odds and price sensitivity (−1 to +1).
- OI (Open Interest): contracts at the chosen strike — higher usually means better liquidity and tighter spreads.
- Scouter Score (1–10): composite rank blending fundamentals, technicals, liquidity, and stability.
- News Sentiment (−1 to +1): recent media tone around the stock.
- Seasonality: November win rate and average return to the same 3rd-Friday expiry (historical).
Historical performance does not guarantee future results. Metrics may be delayed or incomplete. Always verify prices and contract details with your broker.
Top 10 US Covered Call Ideas for Nov 21, 2025 (Snapshot)
-
#1A – Agilent Technologies, Inc.
Snapshot: Price $139.65 · ROO 4.21% · Strike 140 · Δ 0.51 · OI 439 · Scouter 7 · Sentiment 0.52
Seasonality (Nov): Win Rate 76.0% · Avg Return 2.4% · Samples 25
Historical / hypothetical data shown for context only; methodology limitations apply and results are not predictive.
Screen Context: Liquid monthlies and mid/high delta can support income-focused call writing.
Key Risk: Lab-spend cycles can compress valuations and reprice options quickly. -
#2DHR – Danaher Corporation
Snapshot: Price $206.10 · ROO 4.00% · Strike 210 · Δ 0.45 · OI 1,277 · Scouter 6 · Sentiment 0.28
Seasonality (Nov): Win Rate 75.9% · Avg Return 3.4% · Samples 29
Historical / hypothetical data shown for context only; methodology limitations apply and results are not predictive.
Screen Context: Broad healthcare/tools exposure; generally more manageable liquidity for rolls than smaller names.
Key Risk: Macro slowdowns and capex tightening can hit guidance and move the stock fast. -
#3CW – Curtiss-Wright Corporation
Snapshot: Price $556.55 · ROO 3.54% · Strike 570 · Δ 0.44 · OI 307 · Scouter 8 · Sentiment 0.27
Seasonality (Nov): Win Rate 69.0% · Avg Return 3.4% · Samples 29
Historical / hypothetical data shown for context only; methodology limitations apply and results are not predictive.
Screen Context: Defense/industrial blend with a moderate delta profile for balancing premium vs room.
Key Risk: Contract timing and program headlines can trigger sharp repricing. -
#4TMO – Thermo Fisher Scientific Inc.
Snapshot: Price $527.87 · ROO 2.11% · Strike 560 · Δ 0.51 · OI 368 · Scouter 7 · Sentiment 0.46
Seasonality (Nov): Win Rate 65.5% · Avg Return 2.5% · Samples 29
Historical / hypothetical data shown for context only; methodology limitations apply and results are not predictive.
Screen Context: Large platform name; useful if you value stability/quality over maximum ROO.
Key Risk: FX and research-spend slowdowns can hit momentum into month-end. -
#5COR – Cencora, Inc.
Snapshot: Price $319.61 · ROO 3.98% · Strike 320 · Δ 0.51 · OI 3,268 · Scouter 7 · Sentiment 0.40
Seasonality (Nov): Win Rate 65.5% · Avg Return 0.4% · Samples 29
Historical / hypothetical data shown for context only; methodology limitations apply and results are not predictive.
Screen Context: Defensive distribution model; deeper OI may support scaling and smoother execution.
Key Risk: Margin pressure and reimbursement/pricing dynamics can cap upside. -
#6PEP – PepsiCo, Inc.
Snapshot: Price $151.16 · ROO 3.32% · Strike 150 · Δ 0.56 · OI 4,203 · Scouter 6 · Sentiment 0.50
Seasonality (Nov): Win Rate 62.1% · Avg Return 1.7% · Samples 29
Historical / hypothetical data shown for context only; methodology limitations apply and results are not predictive.
Screen Context: Staples profile with very liquid chains for rolling and trade management.
Key Risk: Input costs and FX can shift margin expectations quickly. -
#7SO – Southern Company
Snapshot: Price $99.72 · ROO 2.25% · Strike 100 · Δ 0.50 · OI 2,090 · Scouter 8 · Sentiment 0.30
Seasonality (Nov): Win Rate 58.6% · Avg Return 0.4% · Samples 29
Historical / hypothetical data shown for context only; methodology limitations apply and results are not predictive.
Screen Context: Utility stability with decent OI depth at round-number strikes.
Key Risk: Rate changes and project execution headlines can drive larger-than-expected 1-month moves. -
#8NVS – Novartis AG
Snapshot: Price $129.97 · ROO 2.73% · Strike 130 · Δ 0.52 · OI 494 · Scouter 7 · Sentiment 0.30
Seasonality (Nov): Win Rate 57.1% · Avg Return 0.6% · Samples 28
Historical / hypothetical data shown for context only; methodology limitations apply and results are not predictive.
Screen Context: Defensive pharma exposure; useful when you want steadier premiums vs high-beta names.
Key Risk: Trial/label newsflow can gap the stock and alter assignment odds quickly. -
#9MNST – Monster Beverage Corporation
Snapshot: Price $68.65 · ROO 3.36% · Strike 70 · Δ 0.42 · OI 778 · Scouter 8 · Sentiment 0.40
Seasonality (Nov): Win Rate 51.7% · Avg Return 5.2% · Samples 29
Historical / hypothetical data shown for context only; methodology limitations apply and results are not predictive.
Screen Context: Higher ROO with a lower delta profile; can offer more upside room than closer strikes.
Key Risk: Valuation sensitivity and competition can amplify drawdowns. -
#10PPL – PPL Corporation
Snapshot: Price $37.97 · ROO 2.43% · Strike 38 · Δ 0.51 · OI 1,826 · Scouter 7 · Sentiment 0.73
Seasonality (Nov): Win Rate 44.8% · Avg Return 1.0% · Samples 29
Historical / hypothetical data shown for context only; methodology limitations apply and results are not predictive.
Screen Context: Utility exposure with decent OI at common strikes; may fit conservative income frameworks.
Key Risk: Capex needs and regulatory outcomes can shift expectations and reprice quickly.
US Top 10 — November 2025 Chart
This graphic summarizes each pick’s ROO %, Δ (delta), OI, and Win Rate (Nov). Higher ROO offers more premium; Δ tunes assignment risk; higher OI generally means better liquidity.
How to Use This Snapshot (Practical Checklist)
- Refresh first: confirm today’s price, spreads, and the exact strike/expiry in your broker.
- Pick a delta range: ~0.20–0.35 (more room/less assignment risk) vs 0.40–0.55 (more premium/more assignment risk).
- Liquidity matters: prefer higher OI and tighter spreads—especially if you plan to roll.
- Event risk: check earnings, guidance, and major regulatory/catalyst dates before entering.
- Plan exits: decide whether you’ll close early, roll, or accept assignment.
Educational guidance only — not trading advice.
What to Do Now
- Open the free US screener: us.optrader.ca.
- Set Option Type = Calls and Expiry = Fri, Nov 21, 2025 (3rd Friday).
- Start with filters like: ROO 2–4%, Δ 0.20–0.40, OI ≥ 100, and exclude earnings within 30 days.
- Sort by Scouter Score, then review sentiment and November seasonality for your final shortlist.
Reminder: Numbers here are a snapshot. Always refresh in the screener before acting.
FAQ
Is this a recommendation or signal?
No. This page presents a rules-based screening snapshot for educational purposes.
It is not a recommendation, alert, or personalized trading signal.
How were these ideas selected?
We ranked candidates by November win rate to the same 3rd-Friday expiry (when available), then cross-checked ROO %, Δ, OI, Scouter Score, sentiment, and strike suitability for the Nov 21, 2025 contract.
What does Δ (delta) add here?
Delta helps approximate assignment odds and price sensitivity. Lower Δ usually reduces assignment risk but also premium; higher Δ increases both.
Can I rebuild or tweak this list?
Yes — use the free US options screener at us.optrader.ca to adjust filters by ROO %, Δ, OI, earnings timing, and more.
Any historical performance, seasonality data, “win rates,” or hypothetical results shown are for illustrative purposes only and do not guarantee future results. Market conditions, volatility, and liquidity can change rapidly.
Data may be delayed, incomplete, or inaccurate. Always verify prices, contract terms, and risks with your broker before trading, and consider consulting a licensed financial professional.
🔍 Refresh in the Free US Options Screener
Updated: January 2026