Historical Insights for Optionable Stocks
Explore monthly win rates, average monthly returns, rolling 12-month volatility, drawdowns, and price history—built for US & TSX tickers.
Important Legal Notice
Content and outputs are informational and educational only. Nothing here constitutes investment or trading advice, a recommendation, or a solicitation to buy or sell any securities or derivatives. Outputs are based on historical data and analytics and are not guarantees of future performance. Consult a licensed financial professional before making trading decisions. Optrader is not registered as an investment dealer, adviser, or portfolio manager with any Canadian or international securities authority. Users remain solely responsible for any trading decisions and outcomes.
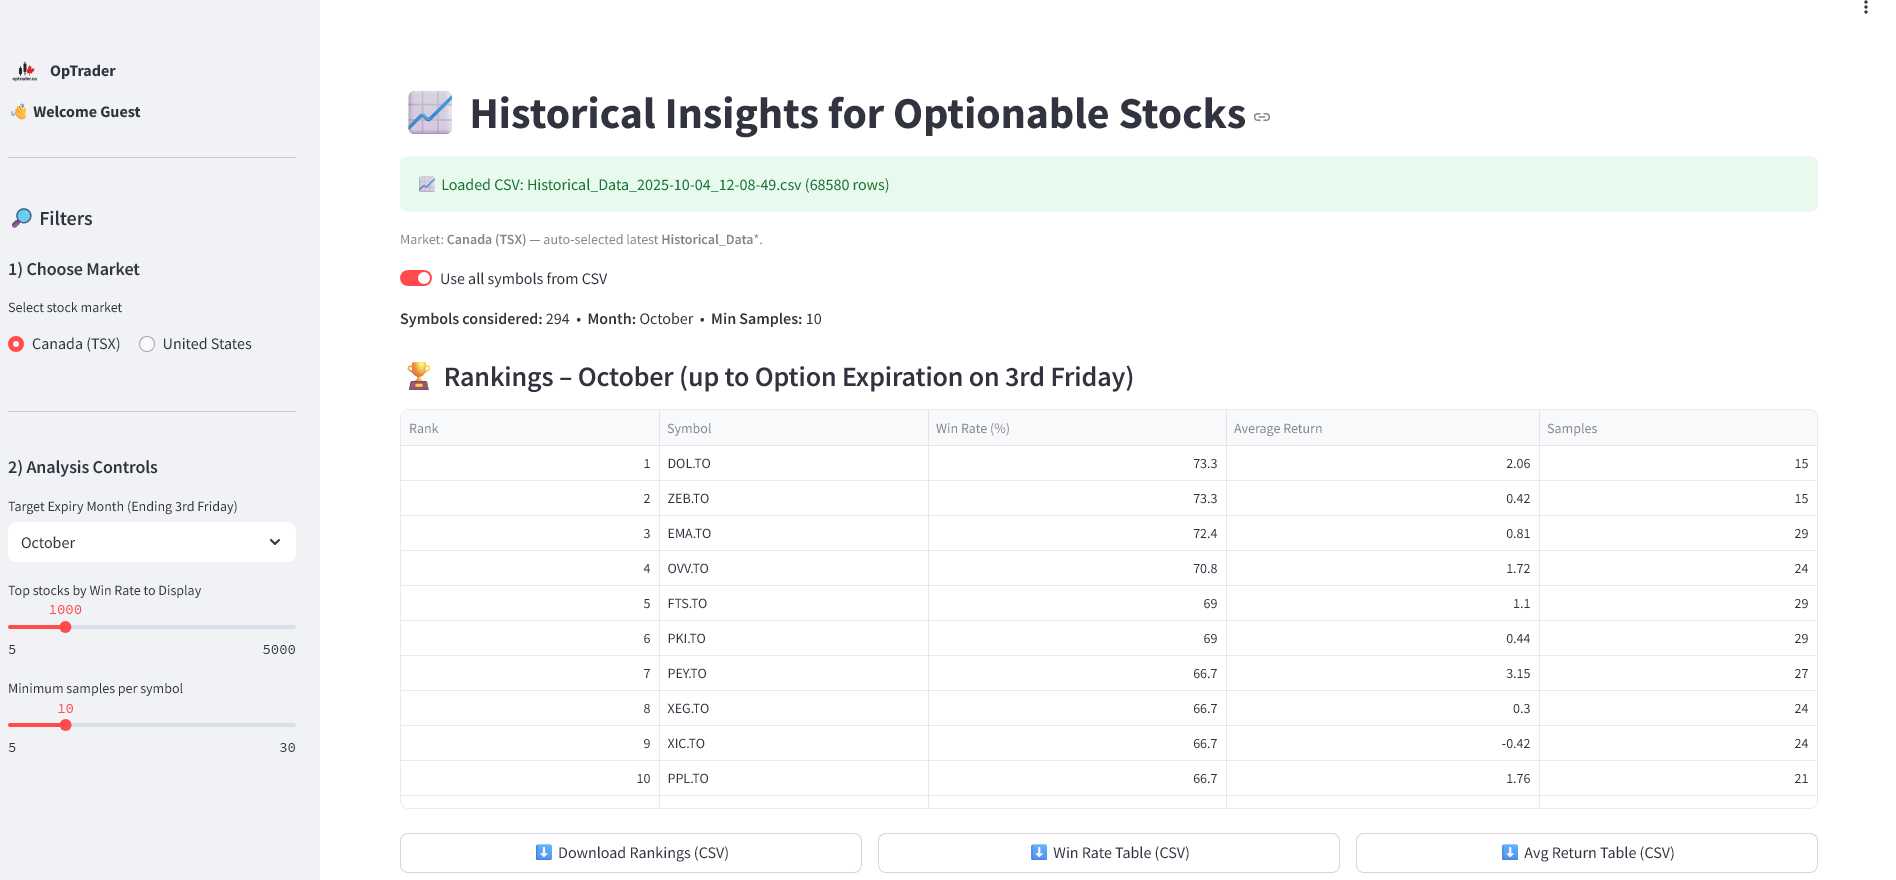
🏆 Win-Rate Rankings
Rank symbols by the share of years with a positive return in your selected month and filter by minimum samples.
🌡️ Seasonality Heatmap
Visualize average monthly returns (Jan–Dec) to spot seasonality patterns at a glance.
📉 Drawdowns & 📈 Volatility
Review rolling 12-month volatility and drawdowns from prior peaks to help contextualize historical risk.
How it works
- Pick market (US or Canada).
- Select target month (e.g., October) and optional symbol filters.
- View rankings, download CSVs, and explore charts (heatmap, returns over time, volatility, drawdowns).
Export tables as CSV and optionally use them alongside your Optrader screener for research and workflow.
Important disclaimer
Optrader is for informational and educational purposes only. It does not provide financial, investment, tax, or legal advice. Historical performance does not guarantee future results. Options trading involves risk and may not be suitable for all investors. You are responsible for your own decisions and outcomes.